The pandemic-driven boom in consumer tech spend significantly reduced the refresh rates for PCs and tablets. New data from IDC’s Consumer Tech Landscape survey makes clear it’s not enough to understand refresh rates in total. Learn why demographics and psychographics matter as you plan for 2021 and beyond.
The Importance of Understanding Refresh Rates by Specific Consumer Groups
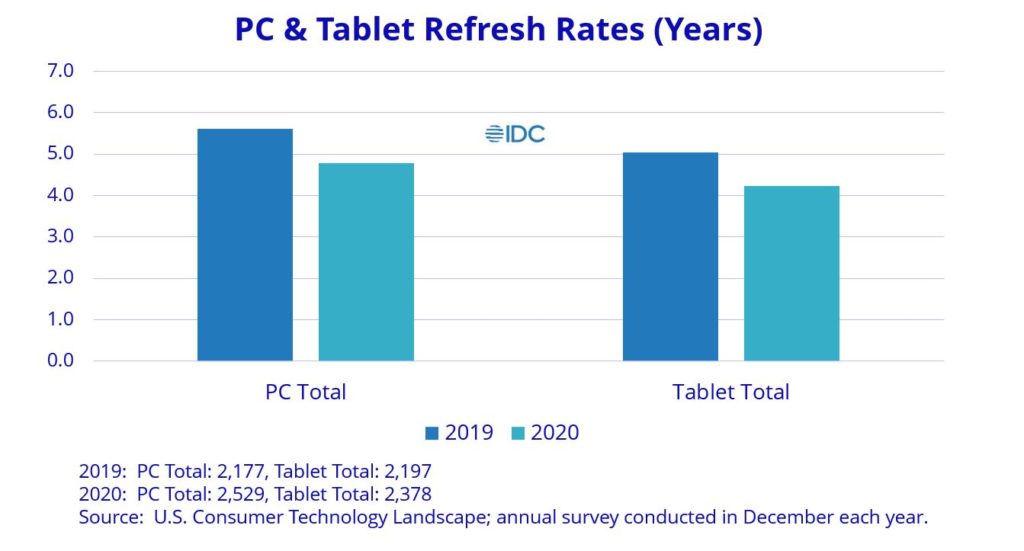
The refresh rate or replacement cycle for a device is the average amount of time a consumer owns a device before buying a new one to replace it. Consumer PC and tablet refresh rates dropped sharply in 2020, reversing the prior trend by which both PCs and tablets had grown “long in the tooth” (hitting their highest point in the last four years in 2019).

A superficial read of this data would be: “Refresh rates went down across the board.” But that would miss a fundamentally important point. Different groups of consumers behave differently, turning over their devices more quickly. Demographics and psychographics impact refresh rates.
Since device marketers are interested in refresh rates because they directly impact planned volumes for a given period, it’s important to understand how these demographics and psychographics impact the opportunity with each consumer segment.
Consumer PC Refresh Rates are Very Different by Demographics
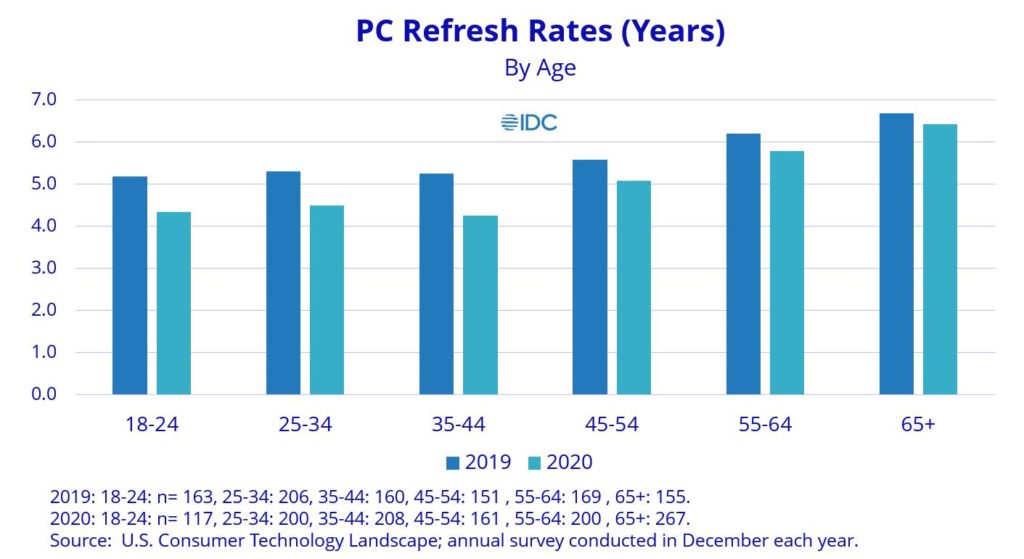
Consumer PC refresh rates are a good example. While refresh rate varies by age, it is not the case that age is directly correlated with the refresh rate in a nice stairstep pattern, whereby the younger consumers turn over their device more quickly than older consumers.
In fact, it is more nuanced. In 2020, PC refresh rates dropped the most among those in the 35-to-44 age bracket. This is a function of both need and disposable income, with many in this age group thriving at work, having rising incomes, and needing or wanting better devices.

Year-over-year changes in refresh rates were also markedly different by other consumer characteristics, such as gender and income.
Refresh Rates are Also Different by Form Factor and Psychographics
Salient differences can also be seen by form factor, with desktops seeing the biggest reduction in the length of the ownership cycle (dropping from 6.1 to 5.0 years). This is, no doubt, connected to other important factors such as the degree to which consumers are gamers or creators. Gaming and content creation both thrived in the pandemic, illustrating the importance of these segments.
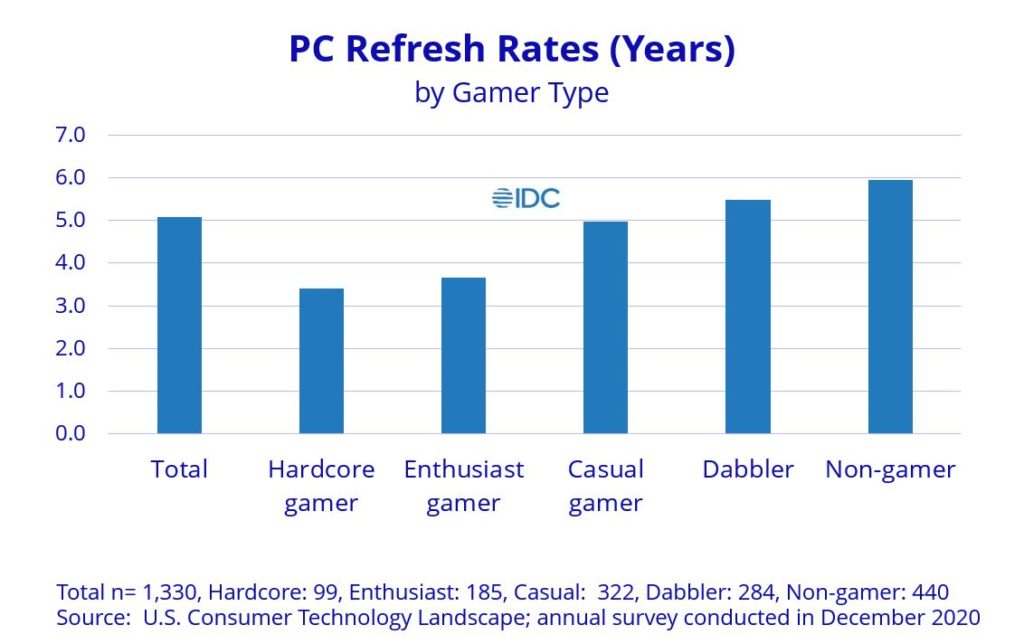
Hardcore and enthusiast gamers turn over their PCs more quickly than those who game less frequently or not at all. We also know that they spend 20% to 25% more on tech than the average consumer. We also know the details of that spend by device and service category and provider.

This demonstrates the importance of being able to reach these two important gamer targets. We see a similar pattern with creators.
Refresh Rates are Also Different by Brand
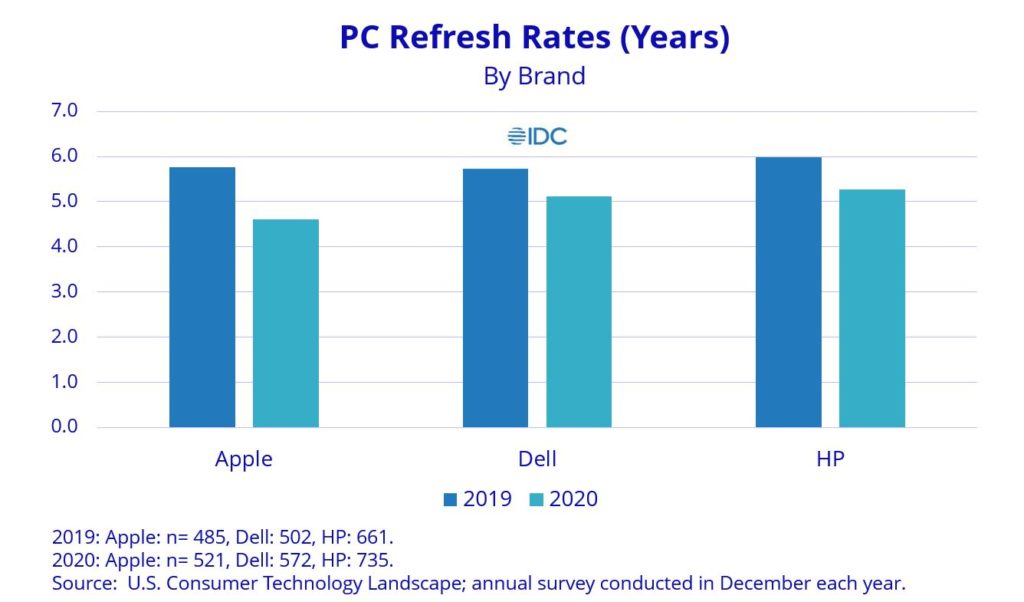
We also see noticeable differences in the refresh rates by brand. Refresh rates reflect their users’ profile and, to some degree, serve as a brand performance metric. By that, I mean healthy brands’ customers turn over their PCs more quickly, motivated by their desire to have “the latest greatest” the brand has to offer.
In 2020, the three leading PC brands saw a shortening of their users’ ownership cycle. Apple saw a bigger reduction, despite starting out from a similar 2019 baseline, helped by strong turnover among Mac and iPad users.

Find Opportunity in the Specifics
While it is increasingly common to hear what “the consumer” is doing, as if consumers were a single monolith, moving as one, they are not. Consumers are different and this impacts refresh rates and other important consumer trends. Truly consumer-centric companies use this granular understanding of consumers to identify opportunity, drive planning, and fuel competitive advantage.
Key Takeaways & Actionability for Product Developers, Marketers & Strategists
- Consumer device refresh rates vary by demographics, psychographics, and other consumer characteristics and are worth exploring in detail.
- Use them to drive planning and competitive advantage.
- IDC’s interactive dashboards are user-friendly tools which can be used to easily identify these differences to support planning.
- Such dashboards exist for PCs, tablets, smartphones and other consumer devices.

Let IDC’s new Consumer Tech Purchase Index (CTPI) be your compass for navigating these uncertain times with our on-demand webinar.
IDC’s Consumer Technology Strategy Service (CTSS) leverages a system of frequent consumer surveys to provide B2C marketers with the full view of the consumer they need to anticipate and meet changing consumer needs and to outperform their competitors. This includes measuring brand trust and helping companies to understand how to cultivate it. In addition to my syndicated service, I work closely with clients on custom research projects and consulting. Find out more here.


