Much has been made of the huge increase in consumer tech spend in 2020 due to the pandemic, and for good reason – consumer spend took a leap forward in 2020.
New research from IDC’s Consumer Tech Strategy Service reveals the winners and losers in the “battle of the brands” for that larger 2020 tech pie. Here’s the story.
Brand Share of Wallet
In 2020, AT&T led the way, well ahead of second place Verizon. Apple took third place – first among device makers – 4 positions ahead of Samsung.
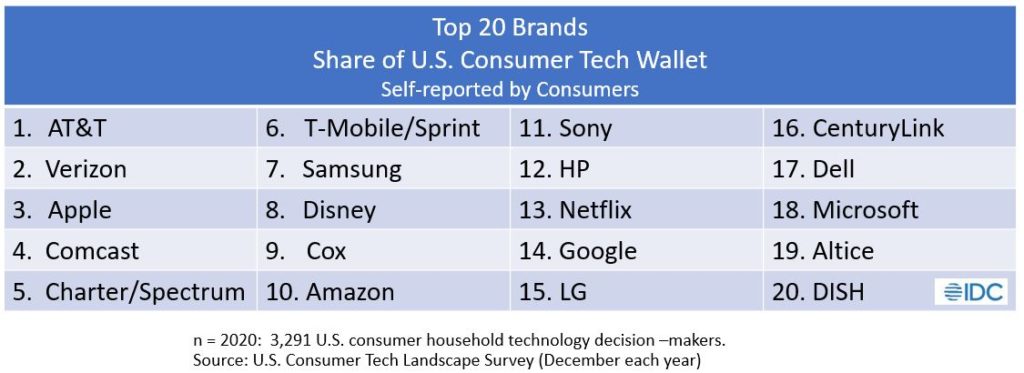
However, being among the top brands in share of wallet doesn’t necessarily mean being one of the brands with the most momentum. In fact, some of the big behemoths are the most vulnerable.
Winners and Losers: 2020 vs. 2019
Importantly, AT&T was the biggest in volume and showed the biggest year-over-year momentum, fueled by growth in broadband and bundled services. Yet, not even this was enough to sustain its then existing consumer business model, plagued by debt, leading it to chart a new course.
From a share of wallet perspective, other top wireless and pay TV brands (each ranked in the top 10 by share of wallet) were the biggest losers. On the wireless side, T-Mobile/Sprint and Verizon lost share of consumers’ spend as carriers agreed not to charge consumers for overage in the midst of the pandemic.
Consumers’ pre-pandemic proclivity to cut the cord was further accelerated by forced time at home, costing pay TV providers like Comcast, Charter, and Cox and benefitting brands like Disney (which includes its HULU streaming service), Amazon, and Netflix.
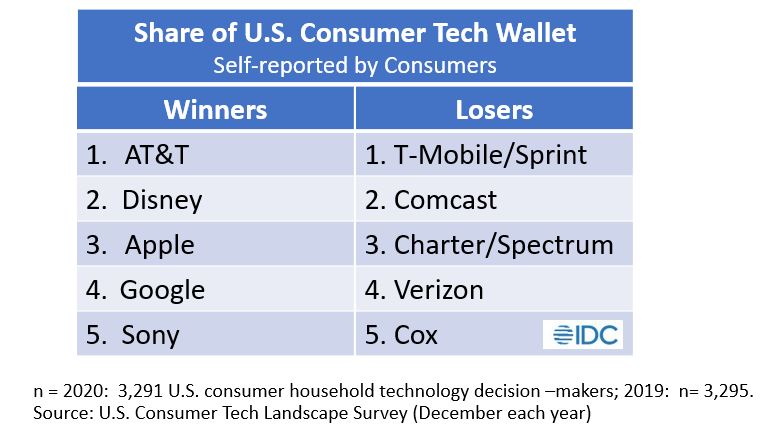
Apple was the third biggest winner. Boosted by big gains in PCs and hearables, and sustained strong, category-defining performance in smartphones, smartwatches, and tablets, Apple moved up the list, overtaking falling Comcast.
Google and Sony rounded out the top brands showing the most improvement. YouTubeTV, YouTube Premium, and smart speakers all contributed to Google’s growth. Sony benefitted from a particularly strong performance in smart TVs and gaming.
Growth Categories: PCs, Video Streaming, Gaming
Three of the most noteworthy growth categories in 2020 were PCs, video streaming and gaming. Most players in each of these categories grew their revenue in 2020. Because of this, it’s worth taking a closer look at each brand’s share of wallet in these categories to highlight the unique insight provided by this share of wallet analysis.
Apple, HP, and Acer – Revenue Winners in the PC Market
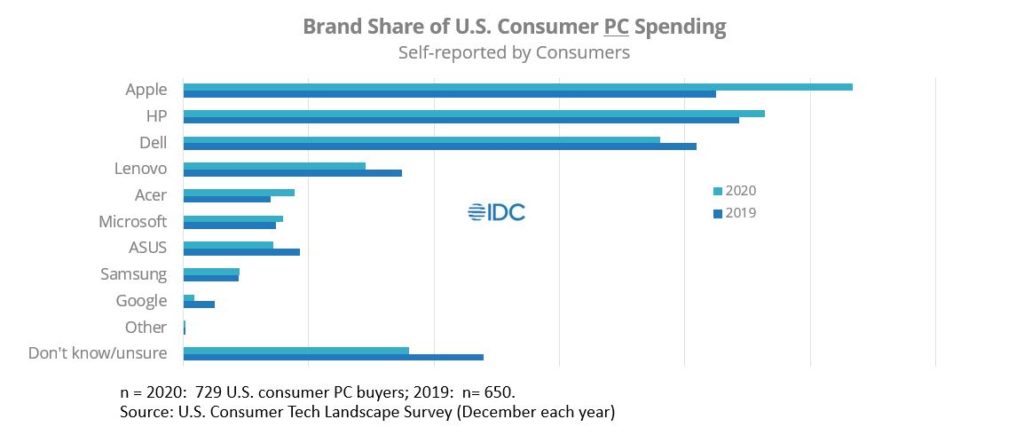
Fueled by work and learn from home, PC sales had a record year of growth. Apple gained over 5 points of share of wallet, overtaking HP for the segment lead, aided by strong Mac performance, both new and old. Despite losing the lead, HP grew its share by a full percentage point and expanded its lead over Dell and Lenovo, both of which grew revenue but lost share of wallet. Acer’s growth propelled it past Microsoft and ASUS.
Streaming Video Winners: Disney and Amazon
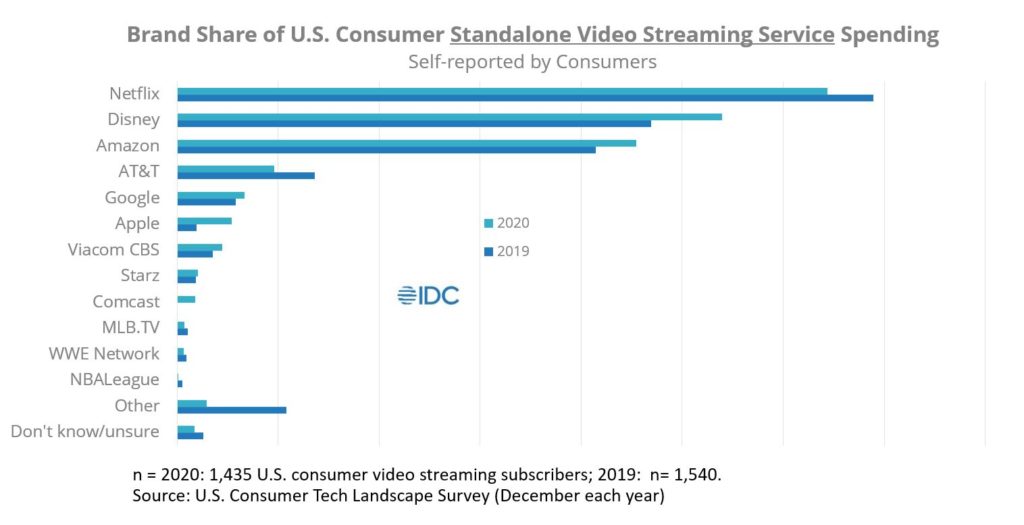
In our analysis of streaming and subscription video services, Disney (including its HULU video streaming service) and Amazon (were the biggest wallet share winners. Segment creator, Netflix, lost share of spend but retains its overall lead.
Gaming
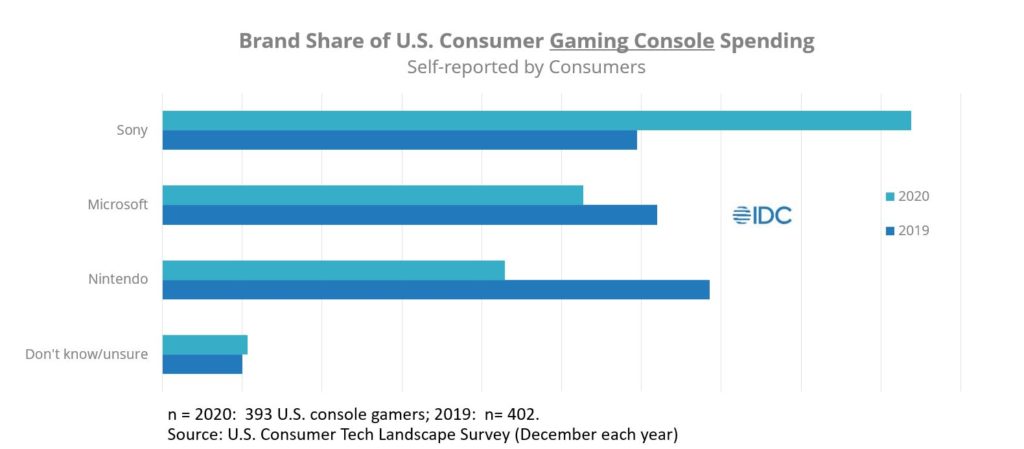
Time spent gaming exploded in the pandemic, driving up spend. Let’s take console gaming as one example. Console, game, and accessories revenue expenditures all expanded significantly, with consumers reporting increases of over 50% for each. It doesn’t hurt that both Sony and Microsoft launched their respective latest generation PlayStation and Xbox consoles in the fourth quarter.
Both companies showed an increase in the dollar amounts of consumer expenditure received in 2020. However, Sony got more than its fair share of console spend, growing its share of consumers’ self-reported expenditures, while Microsoft saw some erosion, outpaced by Sony’s growth.
Nintendo, which only recently announced changes to its signature Switch console, suffered the biggest share of wallet loss in the segment.
Share of Wallet Analysis is Relevant for All Brands and Categories
While I have focused primarily on 2020’s growth categories, this share of wallet analysis applies whether a segment is growing, shrinking, or just flat. And it applies to all product and service categories, including yours.
Key Takeaways & Actionability for Product Developers, Marketers & Strategists
- The pandemic provoked very high levels of tech spending, providing a needed respite for many brands, as the “rising tide lifted all boats.”
- While this growth is welcome, this reality can hide the fact that some brands grew their revenue while falling further behind.
- This can be dangerous to a brand’s health, creating the false impression that everything is okay – until it’s not.
- Avoid falling into this trap.
- Incorporate share of wallet as a KPI for your brand.
- Analysis of each brand’s share of consumers’ tech wallet brings an important perspective, enabling brands to consider their competitive position and the factors truly underlying their growth.
- Is growth being driven by improved performance? An expanding market? Or both?
- Healthy brands generate revenue growth and sustain or grow their share of consumers’ wallet.
- This applies to both device makers and providers of tech-enabled services.
- Get started on your analysis by leveraging IDC’s share of wallet data.
IDC’s Consumer Technology Strategy Service (CTSS) utilizes a system of frequent consumer surveys to provide B2C marketers with the full view of the consumer they need to anticipate and meet changing consumer needs and to outperform their competitors. This includes measuring brand trust and helping companies to understand how to cultivate it.
In addition to my syndicated service, I work closely with clients on custom research projects and consulting. Find out more here.


