
If you are a CIO of an organization that has moved to agile, you may feel that you have lost some oversight over what is happening in the organization. As self-empowered teams work on the development of new functionality, product owners prioritize the work that needs to be done in upcoming sprints, turning the CIO role into more of a facilitator than a decision-making manager.
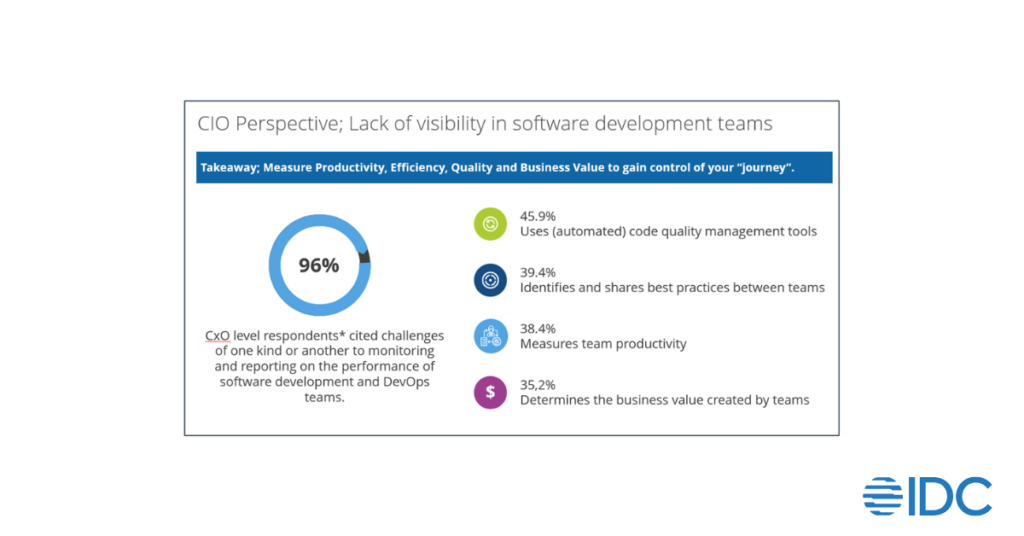
In theory there is nothing wrong with empowered team members. On the other hand, a certain degree of management is necessary to make sure all well intended initiatives are aligned to organizational goals, including the company mission and vision. IDC studies however show that 96% of CIOs perceive a lack of visibility in software development teams[1].
To stay relevant in an ever-changing environment, organizations need to deliver value to their customers. They need to provide value to attract new customers, to retain current customers and to stay profitable. Producing value is largely tasked to development teams in the organization.
Modern CIOs are struggling to find a balance between being a facilitator, trusting their people and being a manager.
It’s often crucial to periodically assess team performance that identifies the high-performing and the low-performing teams as a starting point to understand room for improvement: team performance optimization (TPO).
Team Performance
So, what is team performance? Teams need to provide as much value for the money as possible. The money is often fixed: X persons, working Y hours per week cost Z dollars. When we ask how much value is produced, it becomes more difficult to answer because measuring value is not quantifiable. Value is perceived differently by different individuals and can also vary over time.
It’s widely accepted that functionality, when well-prioritized, has a positive relation with value. Therefore, more functionality delivered should mean more value delivered. And functionality is objectively measurable. There are ISO standards available for functional size measurement, which means that it’s possible to measure the functionality that different teams produce in an objective, repeatable, verifiable way. The functional size units produced are measured by technology that also measures the product quality of the application the team is working on. This technology measures the code against all relevant standards, like ISO25010, ISO5055, CWE, OWASP, NIST, etc. The result is a score on several health factors: Robustness, Security, Efficiency, Changeability, Transferability, and Total Quality.
Optimizing Team Performance
IDC Agile Value Management measures the functional size produced per sprint, release or other time period and collects some basic data like effort via hours spent, cost of these hours and defects logged. This enables us to define 5 key Team Performance metrics:
- Productivity[2]: Effort hours spent per functional size unit
- Cost Efficiency: Cost of effort hours spent per functional size unit
- Delivery Speed: Functional size units developed per calendar month
- Process Quality: Defects per functional size unit
- Value: Functional size units delivered per $1000 spent
These metrics are purely based on the functionality produced, regardless of the technology used or other non-functional requirements. Because these are objective metrics, we can benchmark these against our extensive database to compare the team metrics to carefully selected peers (based on for instance technology, size, complexity, industry, country, etc.). This results in indices that show the relative performance of teams against these peers. For instance, a Productivity Index of 15% means 15% better productivity than the peer group. In this way it becomes possible to both compare the performance of teams against the industry and against each other. Lastly, it becomes possible to identify the best performing teams and the teams that have room for improvement. The next figure shows this.
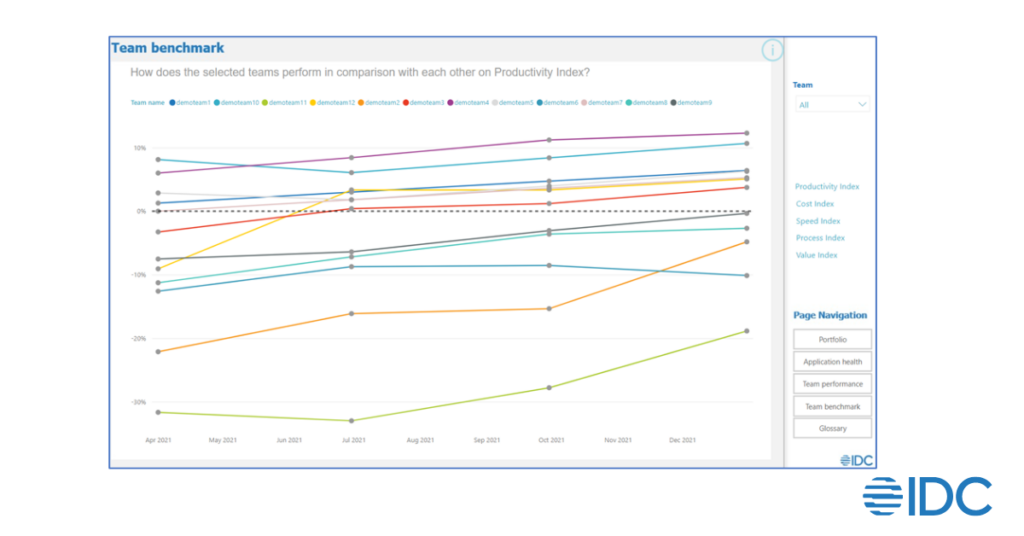
In this example, 12 teams are compared to each other showing their (trends in) productivity. The zero percent line indicates the industry average, and the dots represent the different measurements.
Visibility to Manage Value Creation Function
It’s important to understand that the management information does not necessarily need to be shared with the teams, as they may feel this can be used as a stick to punish low performance. This should never be used to punish, always to understand and to improve team performance.
These insights are the starting point for actual management based on facts. Start with questions like: why is one team performing better than others? Do they use better practices, do they have a better requirements analysis process, better developers that understand the application better, fewer defects, etc.? What is the quality and risk level of the applications the teams are working on? IDC consultants help the teams improve, using best practices that have a proven positive effect on team performance.
As stated before, IDC studies show that 96% of CIOs perceive a lack of visibility in their software development teams. Using Agile Value Management it becomes possible to get an integral view of team performance and the quality of and risks in an application, providing necessary visibility for leaders to move out of being a facilitator only, and to actually manage.
When agile is not properly managed the dollars spent per unit of value delivered can easily go through the roof while the time to value drops significantly.
Learn how IDC Metri helps our clients achieve 35 to 65% reduction in spending or reduced time to market in our eBook:
Sources
[1] IDC Perspective: CIO Guidance for Addressing the Lack of Visibility in Software Development Teams. Part of Future Enterprise Resiliency and Spending Survey (FERS Survey) wave 1, 798 respondents at CxO level.
[2] Productivity is universally defined as output divided by input. However, this results in very small number with many digits. Therefore, the inverse is used which is often referred to as Project Delivery Rate, and called Productivity because this is a term that’s easier to relate to.


